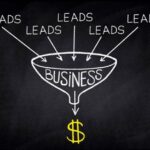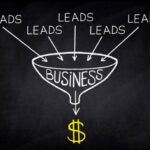
In today’s digital era, visualization of data has become not just a novelty but a necessity for businesses across industries. A profound understanding of data is a guiding force behind many successful organizations. And when it comes to data visualization, funnel charts have proven to be remarkable tools. Below, we’ll delve deeper into understanding what funnel charts are, some funnel chart examples, and their benefits in business.
Understanding the Concept of Funnel Charts

Funnel charts, named for their shape that resembles a funnel, are a unique form of data visualization. They excel in showcasing data that progresses sequentially across stages, making them particularly popular in sales, marketing, and HR domains. Using a funnel chart helps to capture the flow and disposition of data efficiently.
These charts are often divided into multiple stages and tend to grow narrower towards the bottom. The width of each section is proportional to the quantity it represents, allowing for an accurate depiction of the overall process. They also reflect upon underlying patterns and trends in data.
Take a sales department scenario as an example: there’s a larger pool of prospective leads at the beginning of a sales process which tends to thin down through different stages like initial communication, negotiation, and finally closure. Funnel charts paint this reality with complete clarity.
In such a way, funnel charts serve as an excellent tool for companies to understand the evolution of various business processes and refine them as needed.
Practical Funnel Chart Examples for Business
Given their capacity for elucidating processes, funnel charts find application in various business areas. We’ve already seen their utility in sales, marketing, and HR. But that’s not all. Funnel charts are extensively used in customer service, project management, and even production.
Customer service departments often employ funnel charts to monitor the resolution process. The chart can mark customer complaints received, acknowledged, attended to, and finally, resolved, helping in identifying bottlenecks and enhancing the resolution process.
Project management sees a similar benefit with this chart type. Whether it’s tracking project milestones or breaking down tasks until completion, funnel charts visually portray the entire process, assisting in decision-making and efficient resource allocation.
Lastly, production departments use funnel charts to visualize the manufacturing process stages, from raw materials to the final product, thereby boosting efficiency.
The versatility of funnel charts truly makes them an asset across diverse business functions.
Unveiling the Unseen Benefits of Funnel Charts for Business

Being able to visually comprehend data is a significant advantage that funnel charts bring to the table. Still, the benefits aren’t limited to just visualization. The value addition of these charts is much more extensive.
One of the key benefits of funnel charts is their ability to pinpoint stages where the maximum drop-off occurs. Knowing where the bottleneck lies allows businesses to make strategic decisions and improve efficiency.
Funnel charts also facilitate comparative analysis between different periods, aiding in trend prediction. Comparing current period funnels with previous ones enables businesses to identify patterns and make proactive strategic decisions, a powerful tool for growth.
Most importantly, these charts provide a quick snapshot of a process’s health, effectively conveying the story behind the numbers. This narrative is a powerful tool for effective communication within the organization and beyond.
How To Effectively Utilize Funnel Charts for Your Business Growth
Implementation of funnel charts in businesses isn’t rocket science; however, effective utilization involves certain strategies. One basic strategy involves ensuring clarity, both in terms of data representation and labeling.
It’s crucial to ensure the stages are defined clearly to avoid confusion. Additionally, each segment’s width should accurately represent the corresponding quantity to convey the correct picture. This requires careful construction of the funnel chart.
Training staff to properly read and interpret funnel charts plays a significant role too. A workforce adept at reading these charts will be more informed and likely to make more constructive decisions that encourage sustainable company growth.
Sustained monitoring and periodic reviews also play a part. Regularly updating and reviewing the funnel ensures that it remains relevant and accurate, and showcases the real-time status of the process. Regular reviews allow for the timely detection of problems, allowing swift resolution.
Altogether, funnel charts emerge as a compelling tool to visualize data in a straightforward, efficient manner, promoting informed decisions, and leading to superior business growth.


